Handwritten digit recognition (Using Scikit-Learn)
Step 001: Loading the Dataset
importing the dataset
from sklearn.datasets import load_digits
digits = load_digits() following command to know the shape of the Dataset:
print(“Image Data Shape” , digits.data.shape)
There are 1797 images in the dataset
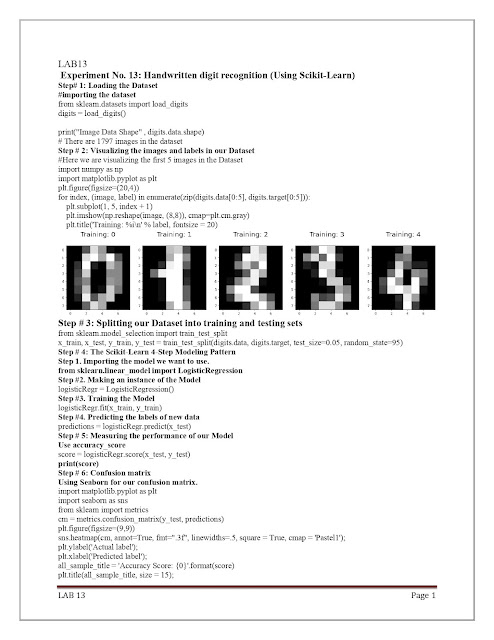
Step 002: Visualizing the images and labels in our Dataset
Here we are visualizing the first 5 images in the Dataset
import numpy as np
import matplotlib.pyplot as plt
plt.figure(figsize=(20,4))
for index, (image, label) in enumerate(zip(digits.data[0:5], digits.target[0:5])):
plt.subplot(1, 5, index + 1)
plt.imshow(np.reshape(image, (8,8)), cmap=plt.cm.gray)
plt.title(‘Training: %i\n’ % label, fontsize = 20)
Step 003: Splitting our Dataset into training and testing sets
from sklearn.model_selection import train_test_split
x_train, x_test, y_train, y_test = train_test_split(digits.data, digits.target, test_size=0.05, random_state=95)
Step 004: The Scikit-Learn 4-Step Modeling Pattern
Step 01. Importing the model we want to use.
from sklearn.linear_model import LogisticRegression
Step 02: Making an instance of the Model
logisticRegr = LogisticRegression()
Step 03: Training the Model
logisticRegr.fit(x_train, y_train)
Step 04. Predicting the labels of new data
predictions = logisticRegr.predict(x_test)
Step 05: Measuring the performance of our Model
Use accuracy_score
score = logisticRegr.score(x_test, y_test)
print(score)
Step 06: Confusion matrix
Using Seaborn for our confusion matrix.
import matplotlib.pyplot as plt
import seaborn as sns
from sklearn import metrics
cm = metrics.confusion_matrix(y_test, predictions)
plt.figure(figsize=(9,9))
sns.heatmap(cm, annot=True, fmt=”.3f”, linewidths=.5, square = True, cmap = ‘Pastel1’);
plt.ylabel(‘Actual label’);
plt.xlabel(‘Predicted label’);
all_sample_title = ‘Accuracy Score: {0}’.format(score)
plt.title(all_sample_title, size = 15);


No comments:
Post a Comment